Gas chromatography of aniline in gasoline
- introduction Due to the restriction of domestic petroleum energy and refining technology, the oil products produced by regular refineries in the market are in short supply, which makes a large number of blended oil products flood the market. Regular blended gasoline is mainly blended with mixed aromatic naphtha (light oil) as raw materials. However, in the background of high raw material prices and maximization of profits, aniline compounds are often used as unconventional gasoline additives. In order to make the quality index of gasoline with such additives meet the national automobile gasoline standard, for example, adding 1% (mass fraction) N-methylaniline can increase the octane number by 2-4 units [1]. However, aniline additives have potential hazards to the mobility and safety of vehicles, and N-methylanilines are nitrogen-containing compounds, which will lead to an increase in the content of nitrogen oxides in automobile exhaust, causing harmful effects on atmospheric environment and human health. The main components of aniline additives include aniline, N-methylaniline, o-methylaniline, p-methylaniline, m-methylaniline and N, n-dimethylaniline. Currently, the commonly reported methods for the detection of methylaniline compounds include naphthalene diethylamine spectrophotometry, gas chromatography-nitrogen chemiluminescence detection, high performance liquid chromatography, etc. [2-4]. The traditional naphthalene diethylamine spectrophotometry interferes with the determination result due to the occurrence of side reaction, and the HPLC method is inevitably affected by the interference of gasoline matrix.
The gas chromatograph-nitrogen chemiluminescence detection method requires the preparation of an expensive nitrogen chemiluminescence detector that can selectively detect nitrogen. The recently drafted (yet to be published) national standard “Gas Chromatography for the Determination of Oxycompounds and aniline Compounds in Gasoline” also describes a method of analysis using Deans switch on two opposite polarity columns using the common and relatively inexpensive hydrogen ion flame detector. For this method, ThermoFisher Scientific has published an Application paper (Application Notes C GC-50). As a simplification, this paper introduces a faster single column method based on the local standard DB37/T-2650 issued by Shandong Province in 2015 [5]. The results show that this method is simple to operate, with good repeatability and high accuracy. At the same time, the method was optimized to solve the problem of interference of aniline quantification by gasoline matrix composition.
2. Overview of the principle of the method On a polar polyethylene glycol (PEG) column, aniline compounds in automotive gasoline were separated from the gasoline matrix, and acetophenone was used as the internal standard. The contents of aniline, N-methylaniline, o-methylaniline, p-methylaniline, m-toluidine and N, n-dimethylaniline in automotive gasoline were determined by gas chromatograph equipped with flame ionization detector (FID), and the concentration of each component was calculated by reference to internal standard.
3. Instruments
3.1 Trace 1300E Gas Chromatograph with shunt/non-shunt inlet,
AS1310 automatic sampler, Flame ionization detector (FID);
3.2 Chameleon Software
3.3 Microsyringe: capacity is 10uL.
4. Reagents and materials
4.1 Column: Polar column, TG-Wax, column length 60m,
Inner diameter 0.25mm, liquid film thickness 0.25μm
4.2 Unless otherwise specified, the reagents used in this method are analytically pure and permissible
Use other reagents of higher purity.
Reagents used for qualitative and quantitative purposes, including aniline (Ca #62-53-3), N-
Methylaniline (CAS#100-61-8), o-methylaniline (CAS#95-53-4),
P-methylaniline (CAS#106-49-0), m-methylaniline (CAS#188-44-)
1) and N, n-dimethylaniline (CAS#121-69-7), the internal standard was phenylene
Ketone (CASA #96-86-2).
5. Experimental methods
5.1 Establishment of standard curve
5.1.1 Preparation of standard solution: All standard substances are isooctane (chromatographically pure)
Dilution, respectively configured with six aniline substances in 0.1%, 0.2%, 0.5%, 1%,
For standard samples at 1.5% and 2% levels, see Table 1 for detailed concentration information.
Table 1. Standard sample concentration table
| Level 1 | Level 2 | Level 3 | Level 4 | Level 5 | Level 6 | |
| N, N, and N, dimethylaniline | 2.0103 | 0.2009 | 0.5044 | 1.013 | 1.4939 | 0.108 |
| N-methylaniline | 0.2114 | 0.4952 | 0.9862 | 1.5518 | 2.0792 | 0.107 |
| aniline | 2.0113 | 1.5514 | 1.0543 | 0.503 | 0.2004 | 0.1067 |
| o-Toluidine | 0.5197 | 1.0019 | 1.4901 | 1.9971 | 0.2149 | 0.1053 |
| p-Toluidine | 1.5042 | 2.1426 | 0.2214 | 0.4756 | 1.0061 | 0.1057 |
| m-Toluidine | 0.9986 | 1.522 | 2.0355 | 0.2378 | 0.5128 | 0.1069 |
| Acetophenone | 0.5197 | 0.5256 | 0.5329 | 0.5473 | 0.5448 | 0.519 |
5.1.2 The standard samples were analyzed according to GC method in Table 2
Table 2. GC method
| Automatic sampler | Sample size:1μL |
| Injection port | mode:shunt,Shunt ratio 100Vaporization chamber temperature:250℃Carrier gas: Nitrogen, constant current,1.0mL//min |
| Column oven | 80℃ (2min)-5℃ /min-240℃ (6min) |
| detector | Hydrogen ion flame FIDtemperature 250℃Hydrogen flow 35mL/minAir flow 350mL/minAfterblow flow 40mL/min |
5.1.3 Qualitative: The components are qualitative according to the retention time of each component, and the chromatogram of the standard sample of the typical type (0.1% concentration level) is shown in Figure 1。
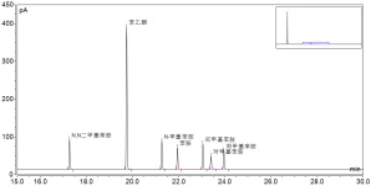
Figure 1. Chromatogram of typical standard sample
5.1.4 Establish a standard curve. Edit the calibration method in the data processing method in Chameleon software, the calibration type is linear (not forced over the origin), the evaluation type is peak area, and the internal standard is variable. The standard curve equation and linear correlation coefficient of each component are shown in Table 3, and the standard curve of each component is shown in Figure 2-7。
table 3. Calibration curve data
| compound | Retention time (min) | Linear equation | Linear correlation(R2) |
| N,N-Dimethylaniline | 17.301 | Y=1.0739X+0.029 | 0.9991 |
| N-Methylaniline | 21.263 | Y=1.0836X+0.0048 | 0.9997 |
| Aniline | 21.944 | Y=0.9947X-0.0289 | 0.9997 |
| o-Toluidine | 23.055 | Y=0.9995X-0.012 | 0.9995 |
| p-Toluidine | 23.406 | Y=0.9168X-0.046 | 0.9996 |
| m-methylaniline | 23.957 | Y=0.9747X-0.0452 | 0.9994 |
5.1.5 Result calculation: The ratio of the peak area of each component to the peak area of acetophenone was calculated. The mass volume fraction of each component corresponding to the ratio is read out from the appropriate correction curve, and the result is accurate to 0.01%。
6. Results and discussion
6.1 Standard curve: The standard curve is established by 6 standard products, the volume concentration range is from 0.01% to 2.0%, and the linear correlation coefficient R2 is greater than 0.999, respectively (see Table 3 for details).。
6.2 Method verification and optimization: Compared with the Deans switch method, the single column method introduced in this paper has the advantages of low cost, simple operation and high reproducibility. However, some components in the gasoline matrix may affect aniline compounds.
For example, according to the method described in this paper, when testing a blank gasoline matrix sample, it is found that after comparing with the chromatogram of the standard sample, there is a peak at about 0.04min (the peak width of the peak is 0.07min) from the aniline component of the standard product, which interferes with the analysis of aniline. (see Figure 2)
3
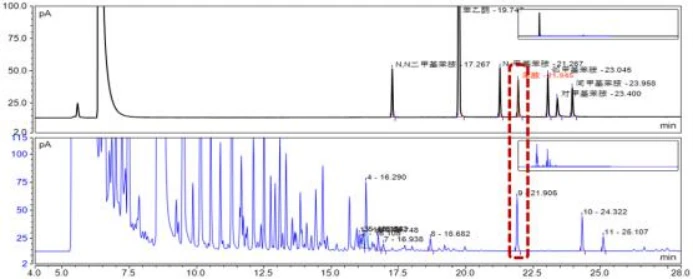
FIG. 2. Comparison between aniline standard solution spectra and blank gasoline matrix spectra
In order to confirm that this substance is not aniline, and eliminate the interference to aniline quantification. The method in this paper is optimized, and the program temperature rise process is
DB37/T-2650 description of 5℃ /min changed to 4℃ /min. The gasoline matrix samples with standard samples added were analyzed by this method. As can be seen from FIG. 3,
The optimized method can separate this component from aniline in gasoline matrix, and further proves that the oil sample can be obtained by DB37/T-2650 method
The peak at 21.905min was not aniline. The interference group was determined to be naphthalene by qualitative mass spectrometry and standard comparison.
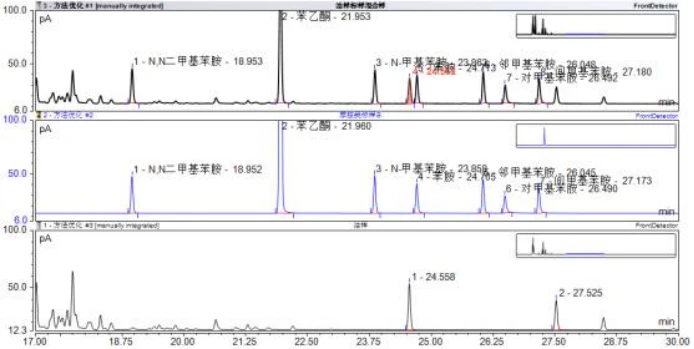
FIG. 3. Comparison of spectra of oil samples, aniline samples and gasoline matrix (optimized method)
6.2 Recovery rate and precision experiment: The standard recovery rate experiment was carried out with blank gasoline matrix, and the standard recovery rate with the addition level of 100ppm was performed (n=5). The results were shown in Table 4.
table 4. Recovery rate and repeatability test results
| constituent | recovery(%) | RSD |
| N,N-Dimethylaniline | 99.21 | 0.55% |
| N-Methylaniline | 94.97 | 0.83% |
| Aniline | 96.83 | 1.05% |
| o-Toluidine | 95.11 | 0.75% |
| p-Toluidine | 106.66 | 1.55% |
| M-methylaniline | 100.12 | 1.35% |
7.conclusion
This experiment refers to the local standard DB37/T-2650 of Shandong Province, and adopts FID detector to detect aniline compounds in gasoline. The method is simple and the result is reliable. Although interference may be used in the actual analysis, the interference of naphthalene in some gasoline substrates to aniline analysis can be avoided by optimizing the conditions.
References:
[1]Zhong Shaofang, WEN Huan et al. Determination of Methylaniline Additives in Motor Gasoline by Gas Chromatography [J]. Spectrum Laboratory, 2012, Volume 29, Issue 6, 3564-3567.
[2]Zhang Maolin, LI Baoding, ZHANG Yufa.Study on the determination of N-methylaniline by Spectrophotometry [J]. Journal of Zhengzhou Grain University, 2000, 21(2) : 86-88.
[3]Liu Baomin, LIU Minghong, XU Hong et al. Study on Simultaneous determination of aniline, N-methylaniline and N, N-dimethylaniline in Air by high performance liquid chromatography [J]. Chinese Journal of Health Inspection, 2009, 19(8) : 1804-1807.
[4]Yang Yongtan, Wu Ming-qing, WANG Zheng.Distribution of nitrogen-containing compounds in catalytic gasoline by gas chromatography-Nitrogen chemiluminescence detection [J]. Chromatography,2010, 28(4): 336 — 340
DB37/T-2650, Determination of aniline compounds in motor gasoline by gas chromatography


